Hello everyone,
Here is a link to my powerpoint presentation.
Russell PowerPoint
Russell
Friday, April 22, 2016
Sunday, April 17, 2016
ABS and Charts
Hi everyone,
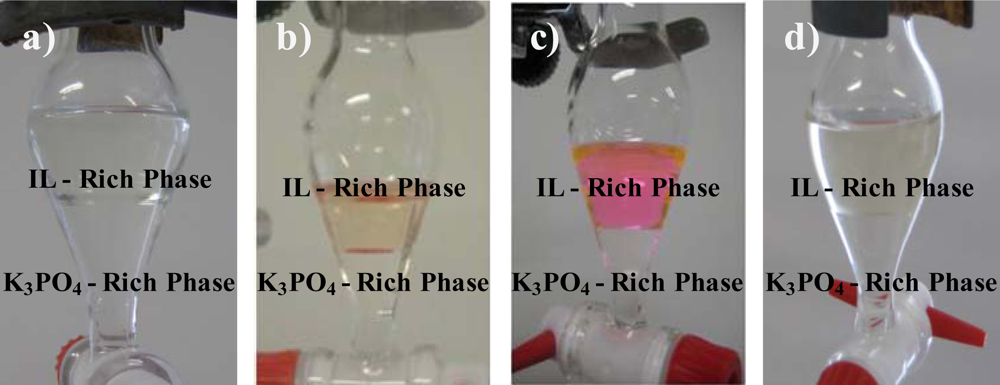
This past week I began mixing solutions to see if I could form aqueous biphasic system (ABS). An ABS is simply when a solution is mixed and after a while, two aqueous layers are formed. This is relevant to my project as the one compound that significantly affects release forms an ABS when mixed with the polymer. Here is a very terrible picture of that ABS.

It can be seen as ABS because there are two aqueous phases, the yellow part at the bottom and the clear part on top of it. Here are better pictures of ABS's that I found online.
(http://www.mdpi.com/1422-0067/11/4/1777)
To simply practice how I plan on doing this and double check my past results, I formed mixtures of all the salts I have used previously and the polymer that forms the hydrogel. As expected, none of the previous materials I used ABS's.
After this, I began doing some reading on what compounds form ABS's and will try various different compounds over the next few weeks.
On Friday last week, I also finally processed the data from two more release studies I performed! The first graph shows a release study where I greatly increased the concentration of acid from the last release study I posted a graph about, and the second graph shows a release study where I doubled the concentrations of acids and salts from that previous release study.


Both of these graphs are very similar to the previous release study I performed: there is some difference between the acids and salts and the control. However, that difference is not nearly as large as the difference with the gel mixed with a drug. And that release profile of the gel mixed with drug is really the goal for this study.
Thanks for reading!
Russell
Saturday, April 9, 2016
A Different Approach
Hi everyone,
This week, I started another release study with double the concentration as the previous release study. Because I was not feeling well on Friday, I was unable to process the data, but that information will be included in my post next week.
I also prepared for another release study with high concentrations of acids. I couldn't use salts because larger amounts of salts would not dissolve into solution. Hopefully, I can have this data next week as well.
These last two release studies hopefully support my previous data or show a correlation between the acid or salt concentration and release times.
As I finish these two release studies, I will begin a different approach to answering my research question of ways to modify drug release.
The new approach is based off of an observation: certain salts or drugs cause biphasic systems to form when mixed with the gels. A biphasic system is simply when a solution has two distinct parts. The hypothesis is that the more likely a compound is to form a biphasic solution, the faster the release will be.
To test this, I will simply mix many compounds together with a particular gel and see if a biphasic system is formed.
See you next week,
Russell
Monday, April 4, 2016
More Data
Hi everyone,
This past week, I accumulated much more data, primarily from the release study I started the week before.
For this study, I mixed the polymers with drugs and a salt or acid. The acids I used were sulfuric acid and hydrochloric acid. The salts I used were sodium chloride and sodium thiocyanate.
Here is a graph showing the amount of drug released at the following time points: 0 hour, 1 hour, 6 hours, 24 hours, and 48 hours. The "control" is the gel without acid nor salt.

 Now, some not so great things. The last two series (the control and the .128mmol salt) are actually not from this release study. Rather, they are from the release study I did before this, the one where I
compared the sizes of the gels to their release profiles. I did this because those gels this time did not look very good as the gel broke apart in the vial (probably because I did not get rid of all the bubbles in the syringe). Although their components and masses are the same, some conditions may have been different, and so there can be some doubt on those results.
Nevertheless, the results do show a particular trend with the additions of different salts or acids, and that's a really good step forward in this research project. Next week, I plan to start another release study with the same materials but at double the concentration. Hopefully those results are similar and support the results from this release study.
Till next time,
Russell
This past week, I accumulated much more data, primarily from the release study I started the week before.
For this study, I mixed the polymers with drugs and a salt or acid. The acids I used were sulfuric acid and hydrochloric acid. The salts I used were sodium chloride and sodium thiocyanate.
Here is a graph showing the amount of drug released at the following time points: 0 hour, 1 hour, 6 hours, 24 hours, and 48 hours. The "control" is the gel without acid nor salt.

Firstly, positives: the shape of this curve is very similar to the curves of release studies in the past. Furthermore, almost all of the curves have the same shape. Also, in the first release study, my data suggested that the gels were not mixed well. However, this time, that was not the case as the gels from the same syringe had similar release data, as shown by this small part of my document.
compared the sizes of the gels to their release profiles. I did this because those gels this time did not look very good as the gel broke apart in the vial (probably because I did not get rid of all the bubbles in the syringe). Although their components and masses are the same, some conditions may have been different, and so there can be some doubt on those results.
Nevertheless, the results do show a particular trend with the additions of different salts or acids, and that's a really good step forward in this research project. Next week, I plan to start another release study with the same materials but at double the concentration. Hopefully those results are similar and support the results from this release study.
Till next time,
Russell
Sunday, March 27, 2016
Something Old and Something New
Hi everyone!
This past week, I started another release study using the same polymers I have used before mixed with a drug and salt/acid solution. I intended to begin the study on Monday, but something unexpected happen: when I mixed the polymer and drug phases together, the following mixture turned white! (they're usually clear after mixing). This occured for each of my samples (acid mixtues, salt mixtures, and neither). This is problematic because this means one of two things: 1) the mixture became a gel or 2) there was simply a very high concentration of salt or drug that could not be dissolved. 1) is problematic because it prevents the gel from being placed into vials where the release studies take place. 2) is problematic because that means that maybe not all the drug or salt can dissolve with that much gel.
To test which of these hypotheses are true, I simply placed the mixtures back into the refrigerator. After a couple of hours, the mixtures became clear again. Thus, 1) was shown true as a decrease in temperature caused the mixture to transition back to liquid. After the mixtures became completely clear, I began the release study and took time points throughout the week.
One possibility for this is the high concentration of the drug (I doubled the drug concentration from previous release studies). The drug may react with the polymer in some way that causes the polymer to become a gel. However, this is just speculation. Furthermore, in the past, this has happened in several cases with different molecules, and cooling the "gel-ed" mixture does not affect results. However, it does affect how I plan release studies for the future as I may need an extra day, or I may need to stay very late some days (it can take around 4-6 hours for the gel to transition back).
With that extra time though, I can analyze how much drug was released by using the plate reader. Furthermore, I will help out another project in the lab.
This project I am helping on concerns the degradation time of the polymer. The degradation time is the time it takes for the polymer to break down to a certain point. This is measured by seeing the temperature at which the gel transitions from liquid to solid (that temperature is called the Lower Critical Solution Temperature or LCST). The higher the LCST, the more the polymer has degraded (this is true because of the properties of the molecules that compose of the polymer).
To find the LCST of a gel, I have to run a cloud point test. This test is actually the first test I learned when I went to lab over the summer. Simply, I heat a water bath to a certain temperature. Place the gels in the water bath at that temperature for a minute. Then dry of the container and place it in a spectrophotometer. This time, I measure the absorbance for the color white. Thus, if the gel is clear, the spectrophotometer will read 0. At multiple temperatures, I measure the absorbance. With this data, I can approximately determine where the LCST is.
Hopefully this week I can attain lots of data. If I do, I will share them with you next week.
See you then!
Russell
Friday, March 18, 2016
Second Try
Hi everyone,
This week, I began another release study. As mentioned in my last post, the goal of this study was to see the differences in drug release between different masses of gels (related to the surface area to volume ratio as the gels are placed into a vial) and to double check my technique as my results from
my last test looked wonky.
Last Monday (the week during Spring Break), I actually went to lab and prepared for this release study, so that I could start it the following week. Because there are time points one day and two days after the start of the study, my mentor (who takes time points for me when I am not there), I prefer to start release studies on Mondays and so I need to prefer much beforehand.
So, this Monday, with preparation finished, I was able to start the release study quickly and take a couple of time points before I left. Later the night and Tuesday, my mentor took more time points. On Wednesday, I took another time point and ran a test to see amount of drug released so far from the gels.
Here is a graph of the cumulative release over these four days (Sorry for the poor quality, I had to take a screenshot since I don't have paint on this laptop and I cannot find how to copy and paste from Excel or attach files on Blogger):

If you cannot see it well, here is a summary: the top three lines are from the gels without the salt with the topmost line being the gel with the lowest mass. The bottom three lines are from the gels with the salt with the highest of the those three (the purple one) being the lowest mass as well.
Overall, I am mostly satisfied with this data/graph because the difference between the release profiles of the gels with and without the salt are as large as expected (my mentor performed a similar procedure previously without the various masses). Furthermore, that difference is mostly constant with the different masses in the gel. This is especially seen with the lowest mass curves as they are both significantly higher than the other two masses (I used 200 mg, 300 mg, and 400 mg).
However, one reason for doubt is the flatness of the curve after two days. As the curve becomes more flat, the more likely it is that the release is ending. In other words, the slope of the line between each time point is always decreasing. Thus, do the bottom three lines, or any really, reach 100% release? If not, I may have made a mistake somewhere. To check this, I plan to take a time point next Monday (7 days after the study has started and usually around the time when release ends) and see the release.
Nevertheless, the positives outweigh the negatives so far in this case, and so the following week, I want to start a new release study, going back to the first release study I did in which I tested various acids and salts and their effects on release. Hopefully, this time my results make more sense and say something more meaningful.
See you next week!
Russell Llave
Friday, March 11, 2016
Spring Break
Hi everyone,
I'm on spring break this week, so I will not be posting.
See you next week!
Russell
I'm on spring break this week, so I will not be posting.
See you next week!
Russell
Friday, March 4, 2016
First Results
This week, I processed the data from my previous release study, and after seeing the results, I planned for how to go forward with my project.
As mentioned in my previous post, the way I measure the amount of drug released from the gel, I take aliquots of the solvent in the vial into tubes at different times. Each time I place some solvent in a tube, I replace the solvent in the vial. After a certain time, I place a small sample of each tube onto a plate reader. The plate reader is then placed into a spectrometer which measures the absorbance of the sample of a particular wavelength of light. The results from the spectrometer transferred to an excel document look like this

The bottom line of the results does not have samples from the release study. Rather, they are standards I created. Standards are samples in which the concentration of a particular drug is known (because I made them). They are necessary because they show the relationship between absorbance and concentration. When I plotted the absorbance of the standards against their calculated concentrations, I created the following graph

Firstly, as shown by the high R2 value, a linear approximation is appropriate, and so the equation listed in the graph is used to calculate the concentration of each of the samples from the absorbance in the plate reader. After a series of unit conversions, I was able to calculate the mass released from each gel at each time point. Furthermore, a calculated the cumulative release of each gel. To calculate this, I add the mass of a particular time point with the masses of all the time points before it. This is done because the solvent is replaced at each time point. Then, I calculated the theoretical amount of drug within each gel. This can be calculated because the percentage of drug in the gel is known by how I created the gels.
After all of these calculations, I created two graphs. The first graph shows the cumulative amount of drug divided by the total amount of drug for each gel at each time point. The second graph shows the mass at each time point divided by the cumulative release of that gel. “Average” is used because for each type of gel, there were three samples for repetition. In the graph, rather than having twenty-seven different lines, I averaged each sample of each gel. “Control” is a gel without a salt or acid.


One trend shown in these graphs is that a higher concentration of a specific salt/acid has a faster release than the lower concentration of the same salt/acid. Furthermore, the salt/acid mostly had slower releases then the control group. However, my data suggests that the gels were not mixed very well. When I mixed the gels, I connected two syringes and pushed the contents of one syringe into another multiple times. If the gel in the syringe was not mixed well, then some parts of the syringe will have large concentrations of drug, while other parts would have lower concentrations of drug. As one syringe is used for three samples of a gel (for example, one syringe has ~800 mg of gel and so ~200 mg of gel is placed into each vial), the release would be different between the samples. This is shown in the table below.

In addition to this bad mixing, the gels also finished releasing relatively quickly then previous studies done in the lab. Usually, it takes approximately 4-5 days for the gel to finish releasing, while my gels finished in about 1-2 days. A gel is finished releasing when the lines become horizontal in the graph. This may not be a mistake in procedure, but possibly because I used smaller gels and smaller vials, which no one has really used before.
And so, next week, I plan to start a new release study with one control and another compound. In addition to seeing the drug release from these new drugs, I will test another variable: size, specifically surface area and volume. To do this, for each gel, I will have samples of different masses. With this, I can my technique (particularly mixing), see if my variability in results was caused by size of my gels, and hopefully find a relationship between size and release.
Thanks for reading!
Russell Llave
As mentioned in my previous post, the way I measure the amount of drug released from the gel, I take aliquots of the solvent in the vial into tubes at different times. Each time I place some solvent in a tube, I replace the solvent in the vial. After a certain time, I place a small sample of each tube onto a plate reader. The plate reader is then placed into a spectrometer which measures the absorbance of the sample of a particular wavelength of light. The results from the spectrometer transferred to an excel document look like this


Firstly, as shown by the high R2 value, a linear approximation is appropriate, and so the equation listed in the graph is used to calculate the concentration of each of the samples from the absorbance in the plate reader. After a series of unit conversions, I was able to calculate the mass released from each gel at each time point. Furthermore, a calculated the cumulative release of each gel. To calculate this, I add the mass of a particular time point with the masses of all the time points before it. This is done because the solvent is replaced at each time point. Then, I calculated the theoretical amount of drug within each gel. This can be calculated because the percentage of drug in the gel is known by how I created the gels.
After all of these calculations, I created two graphs. The first graph shows the cumulative amount of drug divided by the total amount of drug for each gel at each time point. The second graph shows the mass at each time point divided by the cumulative release of that gel. “Average” is used because for each type of gel, there were three samples for repetition. In the graph, rather than having twenty-seven different lines, I averaged each sample of each gel. “Control” is a gel without a salt or acid.


One trend shown in these graphs is that a higher concentration of a specific salt/acid has a faster release than the lower concentration of the same salt/acid. Furthermore, the salt/acid mostly had slower releases then the control group. However, my data suggests that the gels were not mixed very well. When I mixed the gels, I connected two syringes and pushed the contents of one syringe into another multiple times. If the gel in the syringe was not mixed well, then some parts of the syringe will have large concentrations of drug, while other parts would have lower concentrations of drug. As one syringe is used for three samples of a gel (for example, one syringe has ~800 mg of gel and so ~200 mg of gel is placed into each vial), the release would be different between the samples. This is shown in the table below.

In addition to this bad mixing, the gels also finished releasing relatively quickly then previous studies done in the lab. Usually, it takes approximately 4-5 days for the gel to finish releasing, while my gels finished in about 1-2 days. A gel is finished releasing when the lines become horizontal in the graph. This may not be a mistake in procedure, but possibly because I used smaller gels and smaller vials, which no one has really used before.
And so, next week, I plan to start a new release study with one control and another compound. In addition to seeing the drug release from these new drugs, I will test another variable: size, specifically surface area and volume. To do this, for each gel, I will have samples of different masses. With this, I can my technique (particularly mixing), see if my variability in results was caused by size of my gels, and hopefully find a relationship between size and release.
Thanks for reading!
Russell Llave
Friday, February 26, 2016
Release Studies
Hi everyone,
This week, I set up and ran a drug release study. The goal of a drug release study is to measure the amount of drug released from a gel after a particular duration of time.
To set up the release study, I first mix the gels with a drug solution as described in last week’s blog post. After the gels are mixed, I squeezed approximately 200 milligrams from the syringe into a labeled vial. For each acid/salt used (sodium chloride, sodium sulfate, hydrochloric acid, sulfuric acid) and for each concentration of acid/salt used (0, .2 millimol, .35 millimol), I created three gels. In total, I had twenty-seven vials. After the gels are placed into the vials, they are covered by a solvent and set in a warm room, or a room that is kept around 37C.
Once the study is set up, the next crucial component is taking time points. In this lab, time points are times when some solvent is taken from each vial and placed into a tube that is labeled for the time and for the vial whose content it contains. The rest of the solvent from the vial is thrown out, and then new solvent is added to the vial. This week, I took time points at one hour (after set up), three hours, twenty-four hours, forty-eight hours, and ninety-six hours.
After the time points are taken, a test to determine how much drug was released at each time point can be performed. This is done by taking a small amount of each solvent from the tubes and placing it into an ultraviolet transparent plate (see first picture below). Then the plate is placed into a spectrometer (see second picture below) that sends a particular light through each well and records the absorbance. In addition to placing the solvent/drug solutions onto the plate, a group of standards is created and placed onto the plate. Standards are solutions in which the concentration of drug is known. This is important for calculating the amount of drug because it is from the standard solutions that a linear relationship can be made between the absorbance and the concentration of drug.
Over the past week, I performed all three of those steps. Now, I have to process the data from the spectrometer and examine how the drug was released. Hopefully, I can get this done soon and present it in this blog.
Russell Llave


Friday, February 19, 2016
Massing and Mixing
Hi everyone,
Over the past week, I have come up with my research plan (listed below) and have begun my project.
I will examine the effects of different acids and salts on the release of vancomycin. The salts I will be using are sulfate (SO4 -2) and chloride (Cl-), while the acids I will be using are H2SO4 and HCl. I will also hopefully use thiocyanate (SCN-) (a salt), which the lab just ordered. The reasoning behind the selection of these salts is the Hofmeister series, which, according to Wikipedia, is “a classification of ions in order of their ability to salt out or salt in proteins”. Although the gels are not proteins, the salt out and salt in principles are still applicable. Simply, salting in causes an increase in solubility, while the opposite is true for salting out.
After gels are created and mixed with the vancomycin and a specific salt or acid, the release of vancomycin will be recorded at multiple time points and hopefully, this analysis will result in a specific trend that states that a particular salt or acid alone can affect drug release a certain way.
With that in mind, this week, I created a polymer solution that contained the gel in a solvent and a drug solution that contained vancomycin and a salt or acid. This was accomplished Monday and Wednesday. On Friday, I mixed the solutions together by placing each solution in a syringe and linking the two syringes with a coupler (something that links two syringes). However, when I did this, I realized that I was left with a very small amount of gel. This is probably because when drawing up the solutions into a syringe, I have to use a specific tip. Some of the solution was left in the tip, which I threw away, causing a deficit in the amount of gel I needed. Because I did not have enough polymer or gel solution to add sufficient mass to the syringes, I had to make even more solutions. This I accomplished after realizing my mistake, and I hope to finish mixing the gels on Monday.
This is my first week where I really performed lab work (last week was mostly planning). Having not been in lab for so long, I was clumsy, lost, and confused often. I did not know where to find certain materials. It took me a very long time to perform simple tasks such as getting a certain mass of a material. Furthermore, I made a mistake that requires me to redo hours of my work. Nevertheless, the more time I have been in lab, the more I’ve comfortable I become, and hopefully, I will make less mistakes in the future.
Russell
Thursday, February 11, 2016
First Day
Hi everyone!
Yesterday I spent my first day at Arizona State University.
On Tuesday, my sister, an Arizona State junior majoring in biomedical engineering (my intended major), invited me to shadow her throughout the day when I was not in lab. At 8 a.m., I attended her Biomaterials class with her where I learned about the degradation of three different materials: metals, ceramics, and polymers. Fortunately, the part of the lecture about the degradation of of polymers related to the research done at Dr. Vernon's Biomaterials lab, the lab where I am performing my senior research project. In addition, after I finished my time in lab, I visited my sister's Micro-computing class and learned more about circuits.
After her first class, I went to lab and talked to my mentor, Dr. Overstreet. He first updated me on the research that has gone on in the lab ever since I left over the summer. Afterwards, he gave me more information and specificity about my project.
I will be studying the effects of different acids and salts on the hydrogels created in the lab. Over the next week, I will be creating a research plan deciding which salts to use and calculating the quantities of all the materials. Hopefully, next week, I will be able to really begin my project.
And here are the pictures of the inside and outside of the building where my lab is, ISTB1.


Russell Llave
Picture 1: http://www.kpff.com/portfolio/project/arizona-state-university-istb-1
picture 2: https://cfo.asu.edu/fdm-leed-istb1
Yesterday I spent my first day at Arizona State University.
On Tuesday, my sister, an Arizona State junior majoring in biomedical engineering (my intended major), invited me to shadow her throughout the day when I was not in lab. At 8 a.m., I attended her Biomaterials class with her where I learned about the degradation of three different materials: metals, ceramics, and polymers. Fortunately, the part of the lecture about the degradation of of polymers related to the research done at Dr. Vernon's Biomaterials lab, the lab where I am performing my senior research project. In addition, after I finished my time in lab, I visited my sister's Micro-computing class and learned more about circuits.
After her first class, I went to lab and talked to my mentor, Dr. Overstreet. He first updated me on the research that has gone on in the lab ever since I left over the summer. Afterwards, he gave me more information and specificity about my project.
I will be studying the effects of different acids and salts on the hydrogels created in the lab. Over the next week, I will be creating a research plan deciding which salts to use and calculating the quantities of all the materials. Hopefully, next week, I will be able to really begin my project.
And here are the pictures of the inside and outside of the building where my lab is, ISTB1.
Russell Llave
Picture 1: http://www.kpff.com/portfolio/project/arizona-state-university-istb-1
picture 2: https://cfo.asu.edu/fdm-leed-istb1
Friday, January 22, 2016
An Introduction to Hydrogels, Drugs, and Me
Hello everyone reading this,
I am Russell Llave, a senior at BASIS Scottsdale. In this blog, I will record my experiences in my senior research project. At BASIS, seniors end class at the conclusion of second trimester. In the trimester of school, while everyone else in the school continues to attend class, seniors have the opportunity to complete a senior research project, which requires students to attend an internship for fifteen hours per week, update a blog weekly, and complete a presentation to which anyone can attend.
For my senior research project, I will be working in Dr. Brent Vernon's Biomaterials (link:
ASU Biomaterials Lab) Lab at Arizona State University (ASU). I have only received some details about my exact project, and so I cannot elaborate more on the specifics of my project. However, I do know that I will be working on, as the title suggests, improving shelf life and stability testing of polymers used to form hydrogels. Hydrogels are complex compounds with many applications. The application I will focus on is drug delivery. Hydrogels have a lower critical solution temperature (LCST for short). Below the LCST, hydrogels are liquids, while above the LCST, the hydrogels become solid. While in liquid state, the hydrogel can be mixed with drugs. After being heated to above the LCST, the hydrogel becomes solid and has trapped the drug within its complex structure. Over time, the gel degrades, causing parts of the gel to break off. As a result, drug is released. Thus, if the LCST of a hydrogel is below a human's body temperature, the hydrogel can be placed within a human and locally deliver drugs to specific areas. This can be used during orthopedic surgery, where there is a high risk of bacterial infection.
Over the past summer, I emailed numerous biomedical engineering professors at ASU if they would let me, a high school junior with minimal lab experience, assist with their research. Luckily, multiple professors replied and I ultimately decided to work in Dr. Vernon's lab. For thirty hours per week, I would go to lab and learn about different lab protocols. During this time, I was assigned a project of determining the effects of gamma irradiation on hydrogels. To complete this project, I ran multiple tests on hydrogels that underwent different amounts of radiation and on hydrogels that underwent no radiation. Afterwards, I compared all the data and noted any differences. This experience gave me a better idea of what biomedical engineers do in lab and also taught me many principles and practices in lab that I hope to use throughout this project and in my future as I aspire to major in biomedical engineering in college.
I hope you enjoy my first post and follow me on my adventure.
Thank you.
Russell Llave
Subscribe to:
Posts (Atom)