Hello everyone,
Here is a link to my powerpoint presentation.
Russell PowerPoint
Russell
Friday, April 22, 2016
Sunday, April 17, 2016
ABS and Charts
Hi everyone,
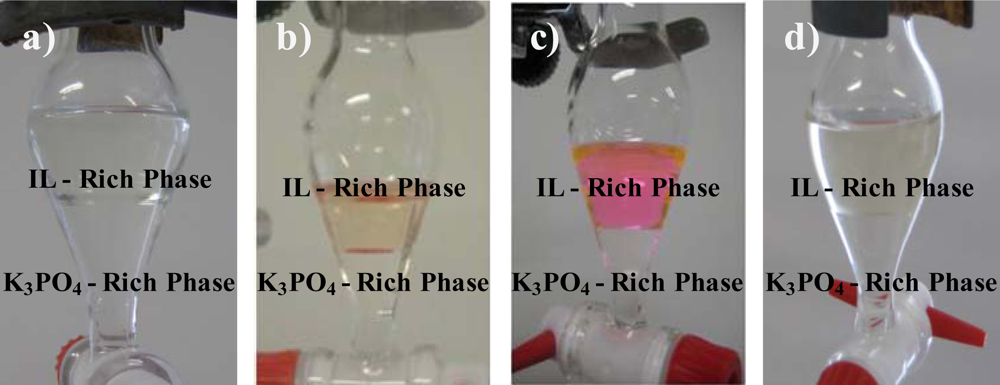
This past week I began mixing solutions to see if I could form aqueous biphasic system (ABS). An ABS is simply when a solution is mixed and after a while, two aqueous layers are formed. This is relevant to my project as the one compound that significantly affects release forms an ABS when mixed with the polymer. Here is a very terrible picture of that ABS.

It can be seen as ABS because there are two aqueous phases, the yellow part at the bottom and the clear part on top of it. Here are better pictures of ABS's that I found online.
(http://www.mdpi.com/1422-0067/11/4/1777)
To simply practice how I plan on doing this and double check my past results, I formed mixtures of all the salts I have used previously and the polymer that forms the hydrogel. As expected, none of the previous materials I used ABS's.
After this, I began doing some reading on what compounds form ABS's and will try various different compounds over the next few weeks.
On Friday last week, I also finally processed the data from two more release studies I performed! The first graph shows a release study where I greatly increased the concentration of acid from the last release study I posted a graph about, and the second graph shows a release study where I doubled the concentrations of acids and salts from that previous release study.


Both of these graphs are very similar to the previous release study I performed: there is some difference between the acids and salts and the control. However, that difference is not nearly as large as the difference with the gel mixed with a drug. And that release profile of the gel mixed with drug is really the goal for this study.
Thanks for reading!
Russell
Saturday, April 9, 2016
A Different Approach
Hi everyone,
This week, I started another release study with double the concentration as the previous release study. Because I was not feeling well on Friday, I was unable to process the data, but that information will be included in my post next week.
I also prepared for another release study with high concentrations of acids. I couldn't use salts because larger amounts of salts would not dissolve into solution. Hopefully, I can have this data next week as well.
These last two release studies hopefully support my previous data or show a correlation between the acid or salt concentration and release times.
As I finish these two release studies, I will begin a different approach to answering my research question of ways to modify drug release.
The new approach is based off of an observation: certain salts or drugs cause biphasic systems to form when mixed with the gels. A biphasic system is simply when a solution has two distinct parts. The hypothesis is that the more likely a compound is to form a biphasic solution, the faster the release will be.
To test this, I will simply mix many compounds together with a particular gel and see if a biphasic system is formed.
See you next week,
Russell
Monday, April 4, 2016
More Data
Hi everyone,
This past week, I accumulated much more data, primarily from the release study I started the week before.
For this study, I mixed the polymers with drugs and a salt or acid. The acids I used were sulfuric acid and hydrochloric acid. The salts I used were sodium chloride and sodium thiocyanate.
Here is a graph showing the amount of drug released at the following time points: 0 hour, 1 hour, 6 hours, 24 hours, and 48 hours. The "control" is the gel without acid nor salt.

 Now, some not so great things. The last two series (the control and the .128mmol salt) are actually not from this release study. Rather, they are from the release study I did before this, the one where I
compared the sizes of the gels to their release profiles. I did this because those gels this time did not look very good as the gel broke apart in the vial (probably because I did not get rid of all the bubbles in the syringe). Although their components and masses are the same, some conditions may have been different, and so there can be some doubt on those results.
Nevertheless, the results do show a particular trend with the additions of different salts or acids, and that's a really good step forward in this research project. Next week, I plan to start another release study with the same materials but at double the concentration. Hopefully those results are similar and support the results from this release study.
Till next time,
Russell
This past week, I accumulated much more data, primarily from the release study I started the week before.
For this study, I mixed the polymers with drugs and a salt or acid. The acids I used were sulfuric acid and hydrochloric acid. The salts I used were sodium chloride and sodium thiocyanate.
Here is a graph showing the amount of drug released at the following time points: 0 hour, 1 hour, 6 hours, 24 hours, and 48 hours. The "control" is the gel without acid nor salt.

Firstly, positives: the shape of this curve is very similar to the curves of release studies in the past. Furthermore, almost all of the curves have the same shape. Also, in the first release study, my data suggested that the gels were not mixed well. However, this time, that was not the case as the gels from the same syringe had similar release data, as shown by this small part of my document.
compared the sizes of the gels to their release profiles. I did this because those gels this time did not look very good as the gel broke apart in the vial (probably because I did not get rid of all the bubbles in the syringe). Although their components and masses are the same, some conditions may have been different, and so there can be some doubt on those results.
Nevertheless, the results do show a particular trend with the additions of different salts or acids, and that's a really good step forward in this research project. Next week, I plan to start another release study with the same materials but at double the concentration. Hopefully those results are similar and support the results from this release study.
Till next time,
Russell
Sunday, March 27, 2016
Something Old and Something New
Hi everyone!
This past week, I started another release study using the same polymers I have used before mixed with a drug and salt/acid solution. I intended to begin the study on Monday, but something unexpected happen: when I mixed the polymer and drug phases together, the following mixture turned white! (they're usually clear after mixing). This occured for each of my samples (acid mixtues, salt mixtures, and neither). This is problematic because this means one of two things: 1) the mixture became a gel or 2) there was simply a very high concentration of salt or drug that could not be dissolved. 1) is problematic because it prevents the gel from being placed into vials where the release studies take place. 2) is problematic because that means that maybe not all the drug or salt can dissolve with that much gel.
To test which of these hypotheses are true, I simply placed the mixtures back into the refrigerator. After a couple of hours, the mixtures became clear again. Thus, 1) was shown true as a decrease in temperature caused the mixture to transition back to liquid. After the mixtures became completely clear, I began the release study and took time points throughout the week.
One possibility for this is the high concentration of the drug (I doubled the drug concentration from previous release studies). The drug may react with the polymer in some way that causes the polymer to become a gel. However, this is just speculation. Furthermore, in the past, this has happened in several cases with different molecules, and cooling the "gel-ed" mixture does not affect results. However, it does affect how I plan release studies for the future as I may need an extra day, or I may need to stay very late some days (it can take around 4-6 hours for the gel to transition back).
With that extra time though, I can analyze how much drug was released by using the plate reader. Furthermore, I will help out another project in the lab.
This project I am helping on concerns the degradation time of the polymer. The degradation time is the time it takes for the polymer to break down to a certain point. This is measured by seeing the temperature at which the gel transitions from liquid to solid (that temperature is called the Lower Critical Solution Temperature or LCST). The higher the LCST, the more the polymer has degraded (this is true because of the properties of the molecules that compose of the polymer).
To find the LCST of a gel, I have to run a cloud point test. This test is actually the first test I learned when I went to lab over the summer. Simply, I heat a water bath to a certain temperature. Place the gels in the water bath at that temperature for a minute. Then dry of the container and place it in a spectrophotometer. This time, I measure the absorbance for the color white. Thus, if the gel is clear, the spectrophotometer will read 0. At multiple temperatures, I measure the absorbance. With this data, I can approximately determine where the LCST is.
Hopefully this week I can attain lots of data. If I do, I will share them with you next week.
See you then!
Russell
Friday, March 18, 2016
Second Try
Hi everyone,
This week, I began another release study. As mentioned in my last post, the goal of this study was to see the differences in drug release between different masses of gels (related to the surface area to volume ratio as the gels are placed into a vial) and to double check my technique as my results from
my last test looked wonky.
Last Monday (the week during Spring Break), I actually went to lab and prepared for this release study, so that I could start it the following week. Because there are time points one day and two days after the start of the study, my mentor (who takes time points for me when I am not there), I prefer to start release studies on Mondays and so I need to prefer much beforehand.
So, this Monday, with preparation finished, I was able to start the release study quickly and take a couple of time points before I left. Later the night and Tuesday, my mentor took more time points. On Wednesday, I took another time point and ran a test to see amount of drug released so far from the gels.
Here is a graph of the cumulative release over these four days (Sorry for the poor quality, I had to take a screenshot since I don't have paint on this laptop and I cannot find how to copy and paste from Excel or attach files on Blogger):

If you cannot see it well, here is a summary: the top three lines are from the gels without the salt with the topmost line being the gel with the lowest mass. The bottom three lines are from the gels with the salt with the highest of the those three (the purple one) being the lowest mass as well.
Overall, I am mostly satisfied with this data/graph because the difference between the release profiles of the gels with and without the salt are as large as expected (my mentor performed a similar procedure previously without the various masses). Furthermore, that difference is mostly constant with the different masses in the gel. This is especially seen with the lowest mass curves as they are both significantly higher than the other two masses (I used 200 mg, 300 mg, and 400 mg).
However, one reason for doubt is the flatness of the curve after two days. As the curve becomes more flat, the more likely it is that the release is ending. In other words, the slope of the line between each time point is always decreasing. Thus, do the bottom three lines, or any really, reach 100% release? If not, I may have made a mistake somewhere. To check this, I plan to take a time point next Monday (7 days after the study has started and usually around the time when release ends) and see the release.
Nevertheless, the positives outweigh the negatives so far in this case, and so the following week, I want to start a new release study, going back to the first release study I did in which I tested various acids and salts and their effects on release. Hopefully, this time my results make more sense and say something more meaningful.
See you next week!
Russell Llave
Friday, March 11, 2016
Spring Break
Hi everyone,
I'm on spring break this week, so I will not be posting.
See you next week!
Russell
I'm on spring break this week, so I will not be posting.
See you next week!
Russell
Subscribe to:
Posts (Atom)