Hi everyone,
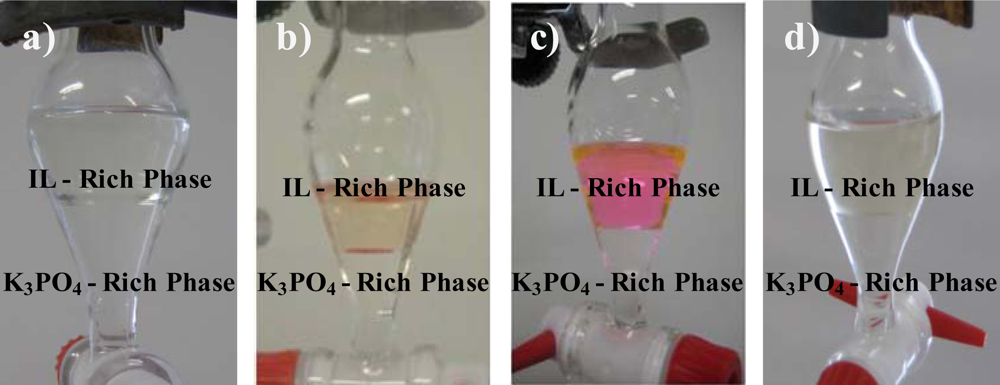
This past week I began mixing solutions to see if I could form aqueous biphasic system (ABS). An ABS is simply when a solution is mixed and after a while, two aqueous layers are formed. This is relevant to my project as the one compound that significantly affects release forms an ABS when mixed with the polymer. Here is a very terrible picture of that ABS.

It can be seen as ABS because there are two aqueous phases, the yellow part at the bottom and the clear part on top of it. Here are better pictures of ABS's that I found online.
(http://www.mdpi.com/1422-0067/11/4/1777)
To simply practice how I plan on doing this and double check my past results, I formed mixtures of all the salts I have used previously and the polymer that forms the hydrogel. As expected, none of the previous materials I used ABS's.
After this, I began doing some reading on what compounds form ABS's and will try various different compounds over the next few weeks.
On Friday last week, I also finally processed the data from two more release studies I performed! The first graph shows a release study where I greatly increased the concentration of acid from the last release study I posted a graph about, and the second graph shows a release study where I doubled the concentrations of acids and salts from that previous release study.


Both of these graphs are very similar to the previous release study I performed: there is some difference between the acids and salts and the control. However, that difference is not nearly as large as the difference with the gel mixed with a drug. And that release profile of the gel mixed with drug is really the goal for this study.
Thanks for reading!
Russell
Ahhhh I love the pictures Russell! I'm glad your results match what you predicted and I can't wait to see it all together in your presentation.
ReplyDelete